496

To Create a Diagram, Time Line, or Flowchart

  1. Question the overall situation for the graphic.
    • Subject: What is the topic of the graphic? What information am I trying to convey?
    • Purpose: Why am I creating the graphic? To show the parts of something (diagram)? To show a sequence of events (time line)? To show the steps in a process (flowchart)?
    • Audience: Who will read the graphic? What information do they need?
  2. Plan your graphic, deciding whether you will use software or will create your diagram, time line, or flowchart by hand. (Go to thoughtfullearning.com/h496 for assistance.)
  3. Research your topic.
    • Consult resources to gather the information you will need.
    • List the parts of the object, the steps of the process, or the events in the time line.
  4. Create your graphic.
    • Diagrams illustrate an object and label its parts. Find or create a picture of the object you want to explain and label the important parts. Include a title. See “Tips for Diagrams” on page 497.
    • Time lines list a sequence of events in the order they occurred. See “Tips for Time Lines” on page 498.
    • Flowcharts show the steps in a process. Use ovals for start and end points, diamonds for decision points, rectangles for steps, and arrows to connect them in the right order. See “Tips for Flowcharts” on page 499.
  5. Improve your graphic.
    • Evaluate the graphic.

      Does it achieve its purpose by presenting the topic clearly? Is it accurate and attractive? Does it include an informative title and clear labels? Do readers understand it?

    • Revise your graphic.

      Remove any parts that are off the topic or unnecessary.

      Rearrange parts that are out of order.

      Redo parts that are confusing.

      Add any missing information.

    • Perfect your graphic, making it clean and correct.
  6. Present your graphic in the best context—online, in a report, or during a presentation.
497

Example Diagram

The following diagram shows the parts of a brake and suspension assembly. Words and images combine to present information.
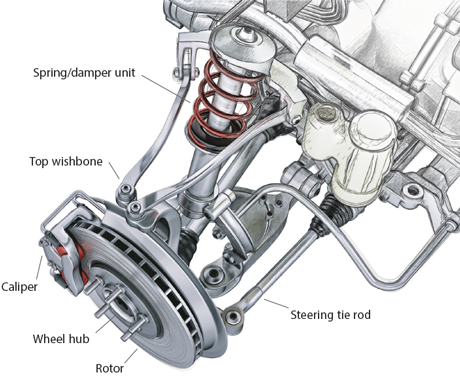
Brake and Suspension Assembly Diagram
 

Tips for Diagrams

Use a diagram to illustrate an object and label its parts. Diagrams are especially useful for explaining complex or unfamiliar subjects.

  • Choose the best type of image for your subject: a simple illustration, a cutaway view (shown above), an “exploded view” (in which parts are pulled away from one another to be seen individually), or a photograph.
  • Draw, photograph, or find the image you want to present. (Remember to respect intellectual property and copyright laws. See page 267.)
  • Clearly label the parts of the object, using pointer lines where helpful.
  • Provide a descriptive title for the diagram.
498

Example Time Line

The following time line traces China’s major ruling families/groups.
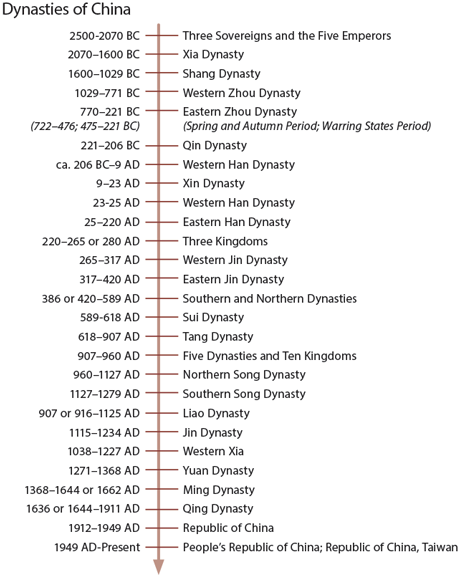
Dynasties of China Time Line
 

Tips for Time Lines

Use a time line to list a sequence of events.

  • Choose the right scale—hour by hour, day by day, and so on.
  • Size your project so that it fits easily on one page or screen.
  • Record your data. List significant events in correct order by date/time.
  • Give the time line a title so viewers perceive the subject quickly.
499

Example Flowchart

This flowchart shows how emergency medical responders make decisions at the scene of an accident.
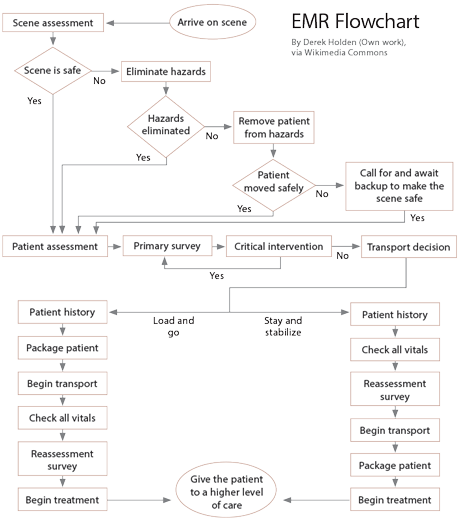
EMR Flowchart by Derek Holden via Wikimedia Commons
 

Tips for Flowcharts

Use a flowchart to outline a process.

  • Use ovals to indicate the start and end points.
  • Use diamonds to indicate decision points.
  • Use rectangles to indicate steps in the process.
  • Use arrows to connect the steps in order. Label the arrows where needed.