Web Page: What Is Data Mining?
Web Page: Data Mining
Opinion: Data Mining Without Big Brother
Web Page: How to Mine Customer Data the Right Way
Web Site: United States Bureau of Labor Statistics
What patterns can you see? Do they accurately predict results from other data?
Remove nonessential information.
Rearrange elements that are out of order.
Redo any part that is unclear or confusing.
Add missing information.
Note: Graphs and tables are often used to present information, but they can also be used to gather and analyze information—a simple type of “data mining.” True data mining employs computer programs to analyze patterns in large databases. For example, a spam blocker searches for similarities between spam emails in order to filter new spam messages; an online shop analyzes customer purchases in order to suggest other products based on what you’ve put in your shopping cart. You can use data-mining techniques to deepen your understanding of a topic by gathering information into a spreadsheet or table, creating graphics that present the data, and analyzing the results.
In the example below, a student reports information gleaned from mining data from a number of reports released by the United States Bureau of Labor Statistics. The information appears both in text and graphic form.
In D.C., Life Ain’t Cheap
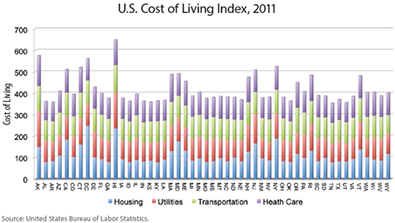
The beginning captures the reader’s attention with an interesting title and a catchy opening.It should come as no surprise that it takes a lot more money to get by in Washington, D.C., than in small-town America. Economists measure this difference by tracking a number of statistics, for example, the consumer price index, the cost of housing (renting or buying), the cost of groceries, and access to other necessities of life.
The middle provides data both in words and in images.The following graph presents a cost-of-living index for each of four basic expenses. Note that, in some places such as California, New York, and the District of Columbia, housing costs far exceed those in other places, while other costs may be the same or slightly lower. For example, though a typical apartment in New York City is astronomically expensive, a typical restaurant meal isn’t. It’s one reason wait staff have a tough time living off low wages and tips. In Michigan, though, the same server would be able to afford better lodgings. . . .This stacked bar graph emphasizes the overall cost of living in each location.

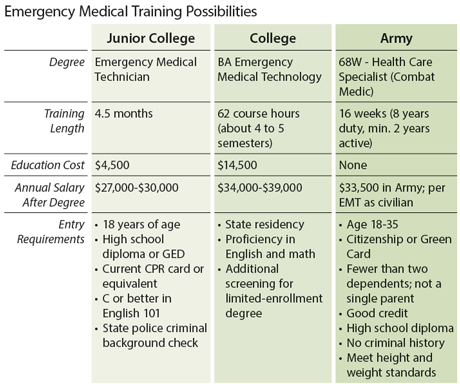
Another data-mining technique uses a features table, which allows a side-by-side analysis of details for two or more subjects. In the following table, a high school student compares three possible career-training paths.

Use data-mining techniques to analyze data and search for patterns.
Web Page: What Is Data Mining?
Web Page: Data Mining
Opinion: Data Mining Without Big Brother
Web Page: How to Mine Customer Data the Right Way
Web Site: United States Bureau of Labor Statistics
© 2014 Thoughtful Learning
