To Write a Lab Report
- Question the situation.
- Subject: What is the topic of the experiment that you will report on?
- Purpose: What is the purpose of the experiment? Are you writing to provide a procedure to replicate, to provide raw data, to interpret results, or all three?
- Audience: Who will read the report? What do they need to know?
- Plan your report.
- Identify your topic, the scientific question that you will explore and test.
Topic: Decomposition
Thought: How efficient are decomposers?
Hypothesis: Different types of decomposers draw different nutrients from decaying material, so a suite of different types will be most efficient.
- Become familiar with the appropriate form for a lab report, one provided by your teacher or the one on pages 467–468.
- Identify your topic, the scientific question that you will explore and test.
- Research your topic.
- Searching: Conduct your experiment using the scientific method (see pages 54–57). Take thorough notes.
- Focusing: Use observations and results to draw conclusions.
Observation: Fruits decomposed by fly larvae and fungi were reduced much more rapidly and completely than those decomposed only by fungi.
- Shaping: Arrange the details of your report.
- Create the first draft of your report.
- Begin with your scientific question and hypothesis.
- Follow with the materials, step-by-step procedure, and observations.
- End with the conclusions based on your findings.
- Improve your first draft.
- Evaluate your first draft.
Purpose: Does the report effectively explain or describe the experiment and results as you planned?
Audience: Will the reader be able to follow your report?
- Revise your writing.
Rewrite parts that are confusing or unclear.
Add details as needed.
Cut parts that don’t relate to the topic.
Reorder sentences or parts that are out of order.
- Edit your revised writing.
Replace general nouns and verbs with specific ones.
Check your writing for accuracy using pages 190–195 as a guide.
- Evaluate your first draft.
- Present the final copy of your lab report to a classroom blog or use it to lead classmates through the same procedure.
Lab Report
The following lab report comes from Eli King, a high school student at Burlington High School in Burlington, Wisconsin. In his lab report, Eli discusses the outcomes of a modern Galileo experiment, exploring the relationship between gravity, velocity, and acceleration.
Modern Galileo Experiment
Question: What is the relationship between velocity and acceleration? How does gravity provide uniform deceleration and acceleration?
Hypothesis: Just as Galileo observed, the acceleration of the cart should be constant.
Background:
Gravity = −9.81 meters/second²
Acceleration = a = Δv ⁄ Δt = (vfinal − vinitial) ⁄ (tfinal − tinitial)
a = acceleration (meters/second2)
v = final velocity (meters/second)
u = initial velocity (meters/second)
t = time (second)
Materials: Cart, motion detector, graphing calculator
Procedure:
- Set up a motion detector at the top of an incline.
- Release a cart. Let it roll freely down the incline.
- Record data from the motion detector. Observe the increase in speed and the constant acceleration.
- Repeat procedure, this time pushing the cart up the ramp and letting it freely roll back down.
- Observe the quadratic qualities of velocity, time, and acceleration.
- Calculate the average acceleration.
Data:
Table (Initial Test)
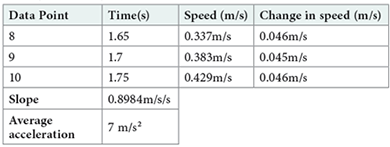
Observations:
Despite a few values at the beginning, change in speed (acceleration) is almost perfectly constant. Our own calculation of acceleration was very close to the projected slope from the motion sensor.
Conclusions:
Hypothesis
We wanted to examine the relationship between velocity and acceleration, as well as the effect of a constant acceleration (gravity). We successfully graphed the motion of our cart as it traveled along the ramp. Our findings revealed a mathematical relationship between acceleration, speed, and position.
Evidence
Our data confirms Galileo’s hypothesis—acceleration is constant. (Ours was nearly constant.) We observed an exponential increase in speed as the cart traveled down the ramp. The journey back down mirrored the trip up, revealing a mirror quadratic relationship between the up and down journeys. This demonstrates that acceleration is constant.
Reliability
This experiment was set up in a way that yielded little human error. We used machines to graph points and observe relationships, harnessing pure data. The only interferences may have occurred during the different cart releases. Perhaps different amounts of force were applied on the cart during different releases. However, even these slight interferences didn’t affect the data as a whole.
Application
This type of knowledge applies to many different real-world scenarios. For instance, throwing a ball straight up in the air and observing its descent exemplifies this idea. It also works in engineering, such as roller coaster design. By examining velocity, acceleration, and angles, roller coaster engineers can design effective and safe rides. These ideas also help calculate the stopping distance of a car. The technical aspects of velocity and acceleration are everywhere, and we often take them for granted.